UC1 Urban Traffic Management in Athens
Description
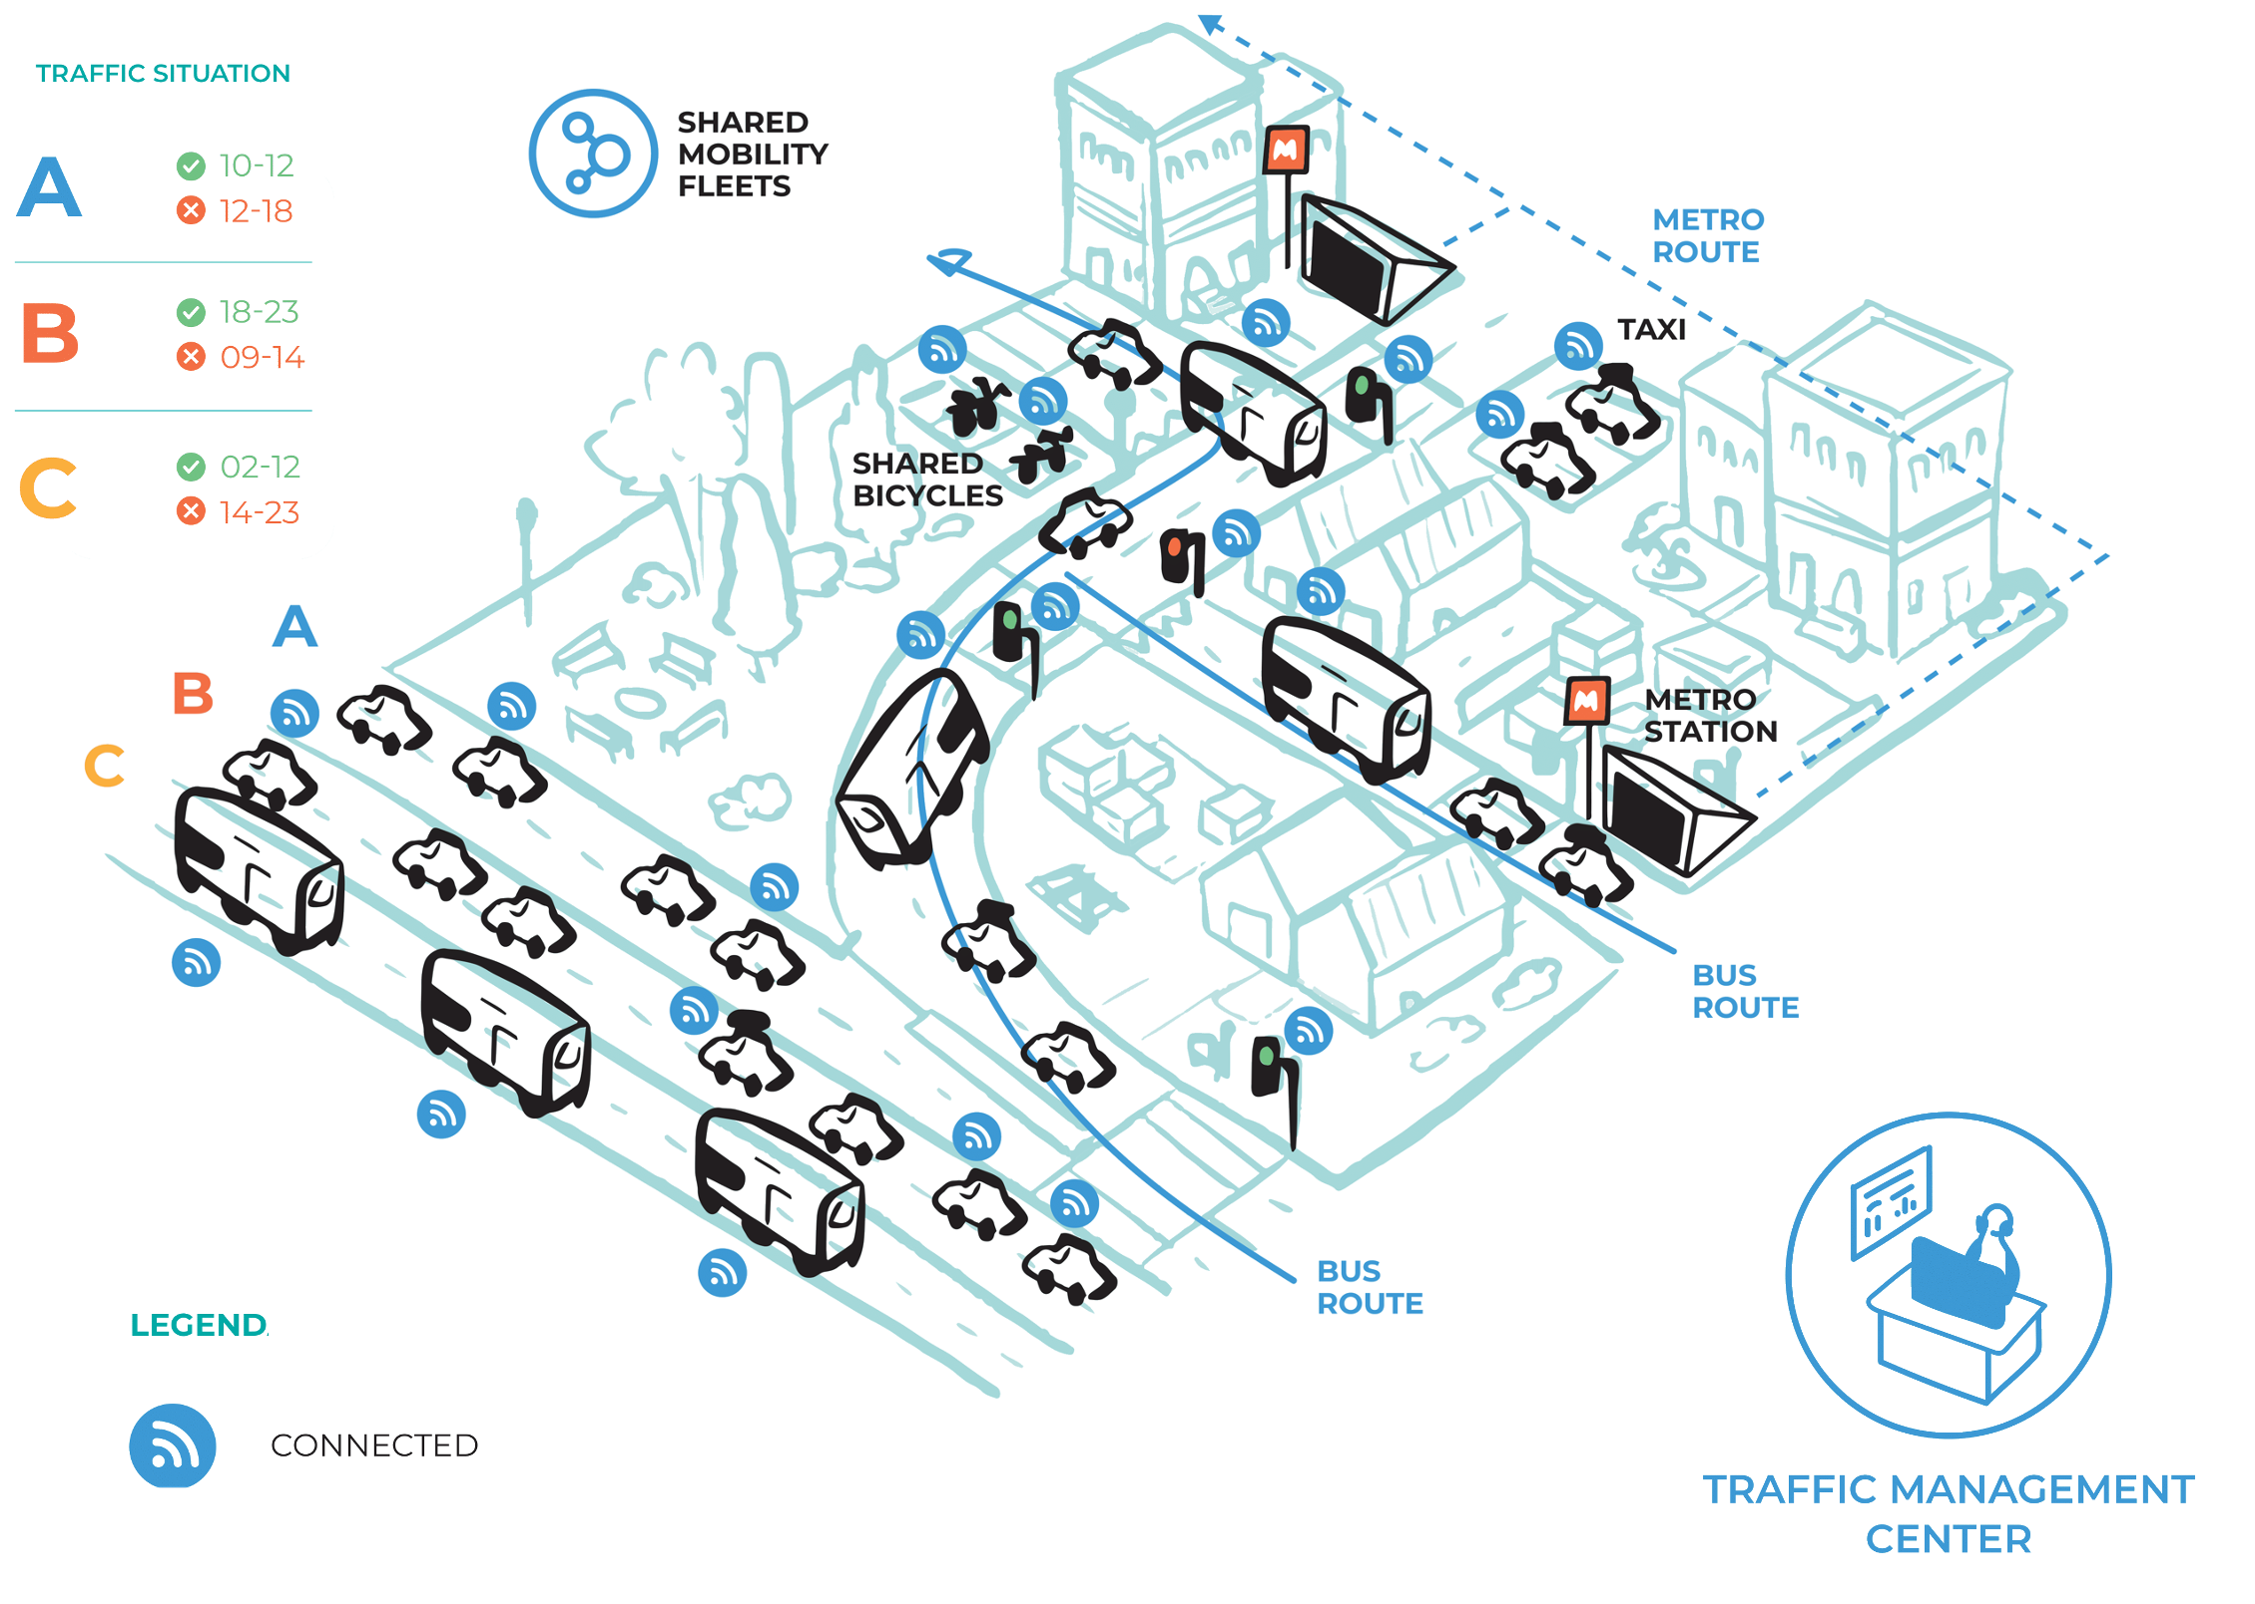
The Athens use case 1 (UC1) showcases innovative traffic management strategies for CCAM, with a particular focus on public transport. Real traffic conditions are used to demonstrate the system’s ability to optimise and balance mobility network loads. The pilot is conducted in the city of Athens, specifically within the inner-ring urban transport network along Alexandras Avenue. This corridor serves as a testbed due to its high multimodal demand, featuring 14 signalised intersections and 21 bus stops serving 18 public transport lines.
Scenarios and Testing
To analyse the impact of implementing the various components developed for this use case, the Athens simulation testbed was used. The public transport network and demand were modelled using historical bus telematics data from the Athens Transit Authority, combined with data from loop detectors to capture general traffic conditions. A model was created to operate in conjunction with the city’s existing sensor network, which also proved sufficient for calculating and testing enhanced ETA predictions.
As the Athens dataset did not include actual ETA predictions, publicly available data from the Netherlands was used to demonstrate the ETA audit functionality. The validation exercises were conducted based on the above setup.
Validation Exercises
- Testing the Cooperative Traffic Management System This component combines dynamic space allocation with traffic signal control to improve urban transport. It aims to replace static dedicated bus lanes with dynamic restrictions that adapt to real-time traffic conditions, increasing road capacity, reducing congestion, and promoting a more balanced urban traffic flow.
- Testing the ETA Estimation of Buses As part of the developed Multimodal Fleet Management System, the enhanced ETA engine is evaluated and benchmarked against existing ETA data. In addition, the Incident Management module and its related sub-modules are also assessed.
- Testing the Vehicle Scheduling Model for Autonomous and Connected Vehicles The developed framework is evaluated to optimise the synchronisation of multimodal transfers for human mobility within a dynamic transport environment.
Key Features
Transit signal priority and dynamic use of bus lanes
Dynamically controls bus lane utilisation under varying traffic conditions to prioritise public transport and manage lane density.
Public transport ETA prediction
Calculates expected arrival times to support efficient fleet management and provide accurate passenger information.
Incident management
Detects, categorises, and prioritises incidents in real time, extracting relevant information to support timely response.
Multimodal vehicle scheduling
Optimises synchronisation of passenger transfers across multiple transport modes in real time.
Key Performance Indicators
Travel times
Time taken by passengers and vehicles to complete journeys, including waiting periods at stops or interchanges.
Punctuality
Punctuality of services, measured by the difference between actual and scheduled arrival or departure times.
Emissions
Environmental impact of completed vehicle trips, measured through total CO₂ and other pollutant emissions.
Fuel/energy consumption
Fuel or energy consumed per passenger carried, indicating operational efficiency and sustainability.
Additional KPIs explore social, economic, technical, and liability risk aspects.
Expected Benefits
- Reduced passenger and vehicle travel times, including passenger waiting times
- Reduced economic losses caused by travel delays
- Lower total distance travelled
- Reduced transport emissions (CO₂ and NOx)
Contribution to the CONDUCTOR Project
- Adaptive traffic management strategies using trained intelligent traffic agents (reinforcement learning)
- A fleet management system (FMS) comprising multiple components to support dynamic public transit control and real-time ETA prediction
- Synchronisation of public transport modes to enable seamless mobility and improve transit system efficiency
Deployment Architecture
Figures 1 to 4 illustrate the integration process of the UC1 components based on the validation exercises.
Figure 1 depicts the process view of the Cooperative Traffic Management System (CTMS) scenario from Validation Exercise 1. The scenario starts with the Demand Calibration Module retrieving public transport telematics and road traffic data from the Mobility Data Platform. Within the CTMS, agents dynamically manage traffic: Signal Controllers adjust intersection phases, while Lane Density Controllers regulate bus lane access and corridor vehicle flow. During simulation, real-time traffic data is continuously exchanged, enabling agents to adapt signals and traffic controls based on current conditions. Finally, key performance indicators are produced and compared with reference scenarios to assess system performance.
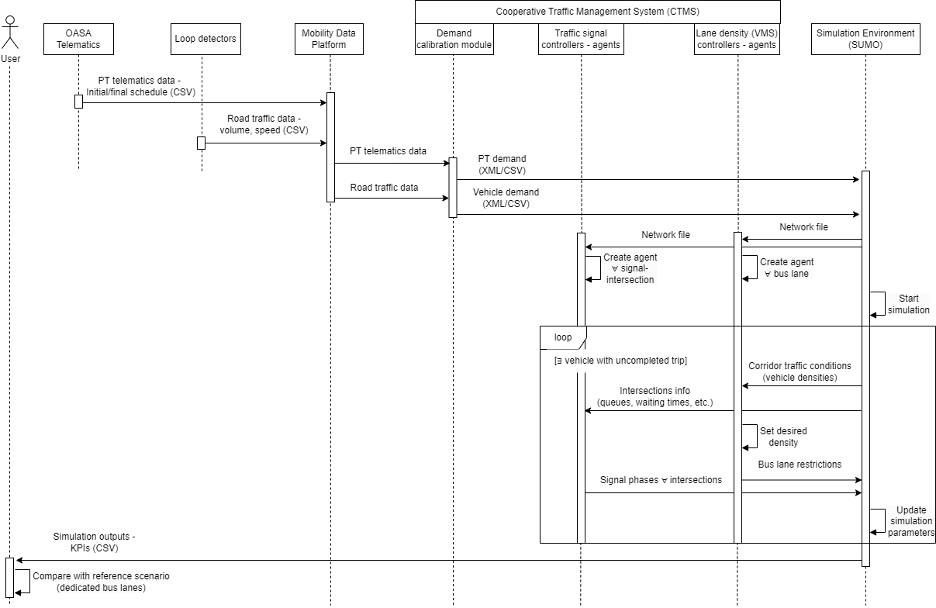
Figure 1. Process view of the Cooperative Traffic Management System.
Figure 2 illustrates the process view for ETA estimation and auditing using the Fleet Management System (FMS). The scenario begins with the Netherlands Public Transit Authority supplying static network and schedule data to the Mobility Data Platform, which forwards it to the Virtual Bus module. Real-time telematics are then sent to the Virtual Bus via the platform. This data powers the ETA Prediction Engine, which calculates expected stop arrivals. These are displayed in the FMS Data Visualisation tool and compared with official predictions to generate an ETA accuracy report for auditing.
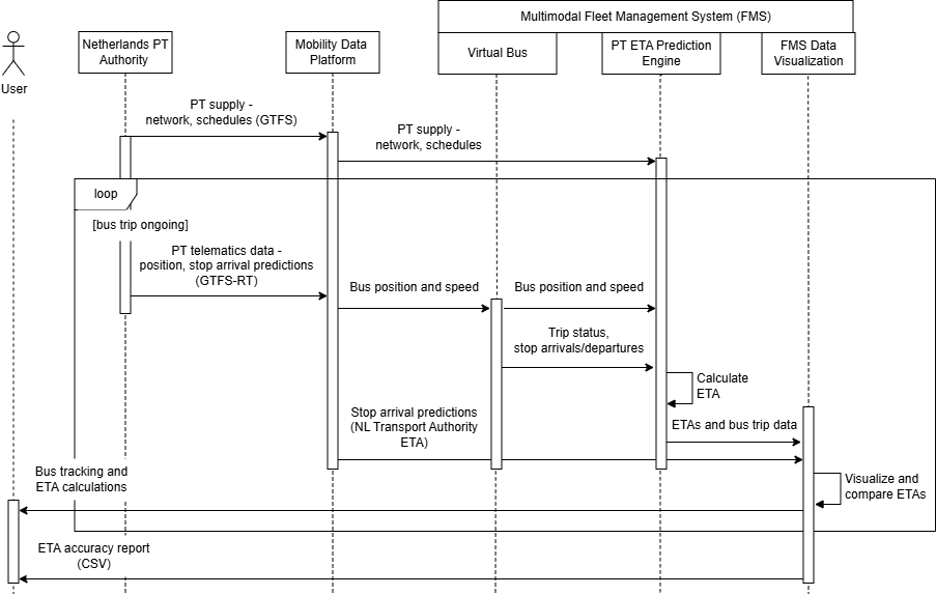
Figure 2. Process view of the ETA auditing of the Fleet Management System.
Figure 3 illustrates the process view for Incident Management within the FMS. The process begins when a traffic incident is detected either automatically or manually through the user interface. The FMS Incident Management module processes, categorises, and prioritises the event, extracting key details. Alerts and notifications are then generated by the FMS Data Visualisation tool and shared with operators and users. The system also supports incident response coordination and produces a post-incident report for analysis.
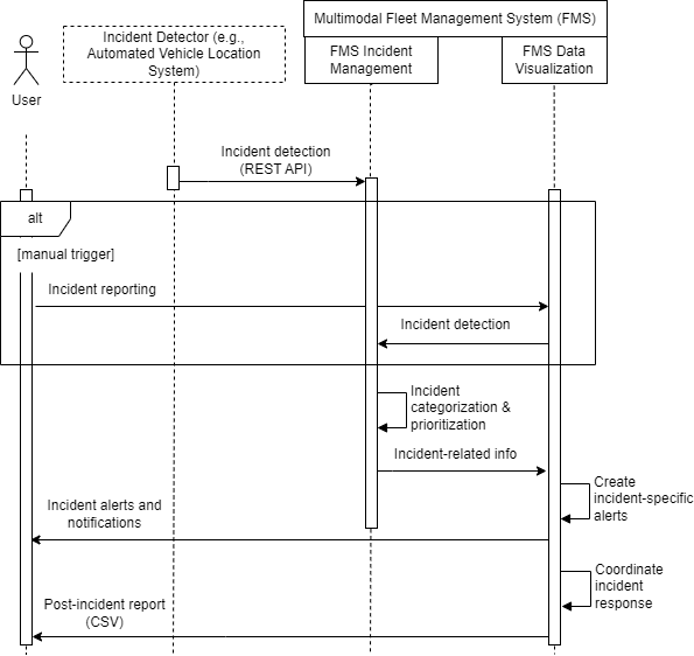
Figure 3. Process view of the Incident Management inside the Fleet Management System.
Figure 4 presents the process view for public transport scheduling using the Vehicle Scheduling Model for Autonomous and Connected Vehicles (VSMACV). The process begins with OASA supplying static public transport schedules, while real-time telematics are continuously collected and processed via the Mobility Data Platform. The Real-Time Control Module generates multimodal public transit status updates and dynamically adjusts control measures such as dispatching, holding, and service synchronisation. After simulation or operations, the updated schedules are compared to reference scenarios to assess travel time and transfer improvements.
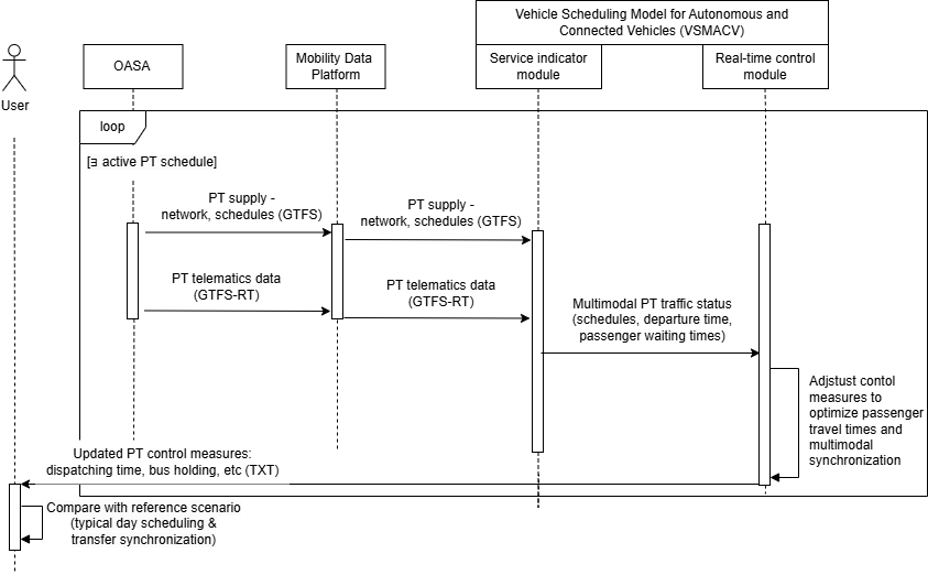
Figure 4. View of the dynamic control processes of the VSMACV.