UC1 Urban Traffic Management in Madrid
Description
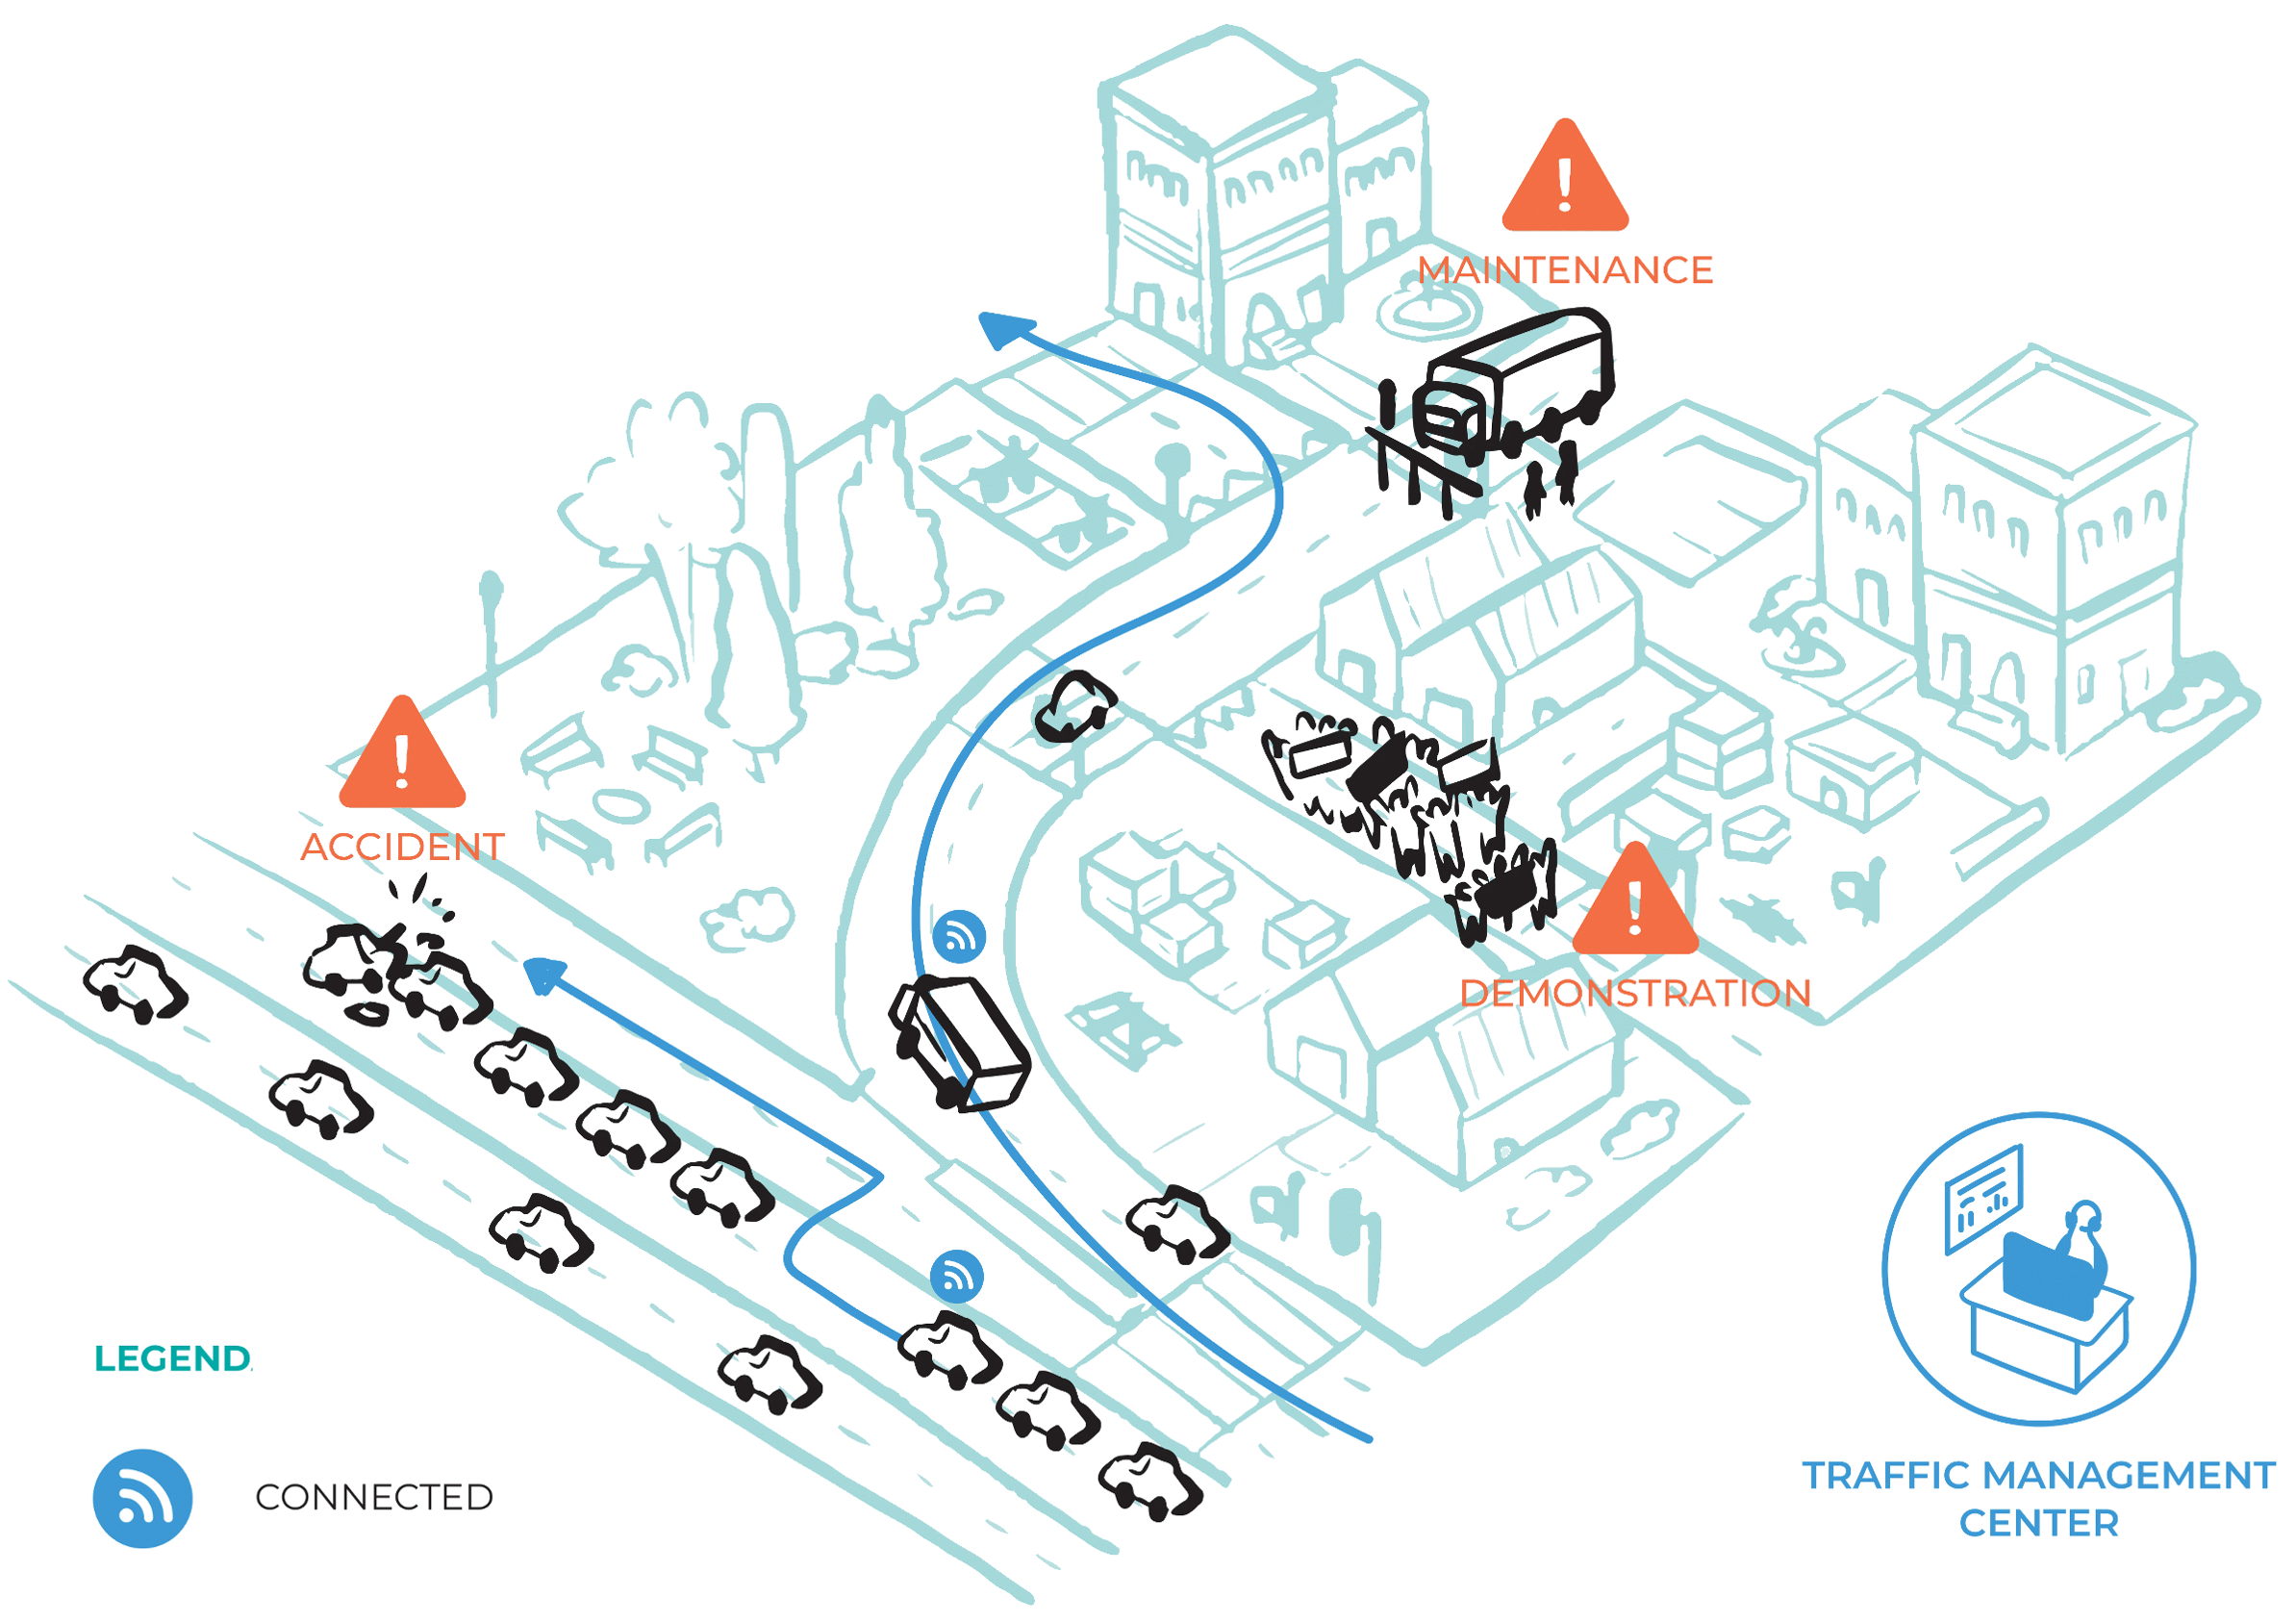
The Madrid use case (UC1) focuses on the management of planned and unplanned events to support the recovery of optimal transport network operations, with a particular emphasis on the integration of Connected and Automated Vehicles (CAVs).
The study area is the Madrid M-30 ring road, a 32 km urban motorway that surrounds the central neighbourhoods of Madrid. The adjacent secondary urban roads offer potential detour routes.
Scenarios and Testing
UC1 is being tested and validated in a simulation environment using the Aimsun Next transport simulation software. This setup enables the evaluation of multiple scenarios under varying levels of CAV market penetration. The simulation emulates vehicle-to-environment communication and delivers personalised information such as:
- Optimal departure times and routes
- Lane selection
- Speed adaptation
An integrated optimisation module dynamically adjusts the schedules and generates new CAV routes, which are then fed back into the simulator.
Simulation inputs include network characteristics, demand levels, and virtual roadside sensor data.
The simulation scenarios are structured as follows:
- Baseline Scenarios: Two baseline scenarios are developed — one for planned and one for unplanned events — which serve as reference points to assess the effectiveness of response strategies during network disruptions.
- Planned Event Scenarios: These simulate scheduled disruptions (e.g., roadworks) and test various congestion mitigation strategies. The traffic mix includes both CAVs and conventional vehicles, assuming connectivity between vehicles and infrastructure. Connected vehicles receive route guidance, and the impact of different CAV penetration rates is evaluated.
- Unplanned Event Scenarios: These simulate sudden, unplanned incidents (e.g., accidents) and apply similar mitigation strategies. The objective is to assess the system’s responsiveness and adaptability under unexpected conditions.
Key Features
Evacuation route planning
Identifying and managing safe, efficient evacuation pathways during emergencies.
Emergency vehicle prioritisation
Ensuring priority access for emergency services through adaptive traffic control.
Access control
Restricting or allowing access to specific zones based on real-time conditions.
Lane management
Optimising lane usage to improve flow and prioritise critical vehicles.
Dynamic rerouting
Providing alternative routes to minimise congestion and respond to disruptions.
Key Performance Indicators
Traffic flows
Volume and distribution of vehicles throughout the network.
Speeds
Average and variability of vehicle speeds under different scenarios.
Travel times and delays
Time taken to reach destinations and the delays experienced en route.
Emissions
Environmental impact measured through CO₂ and pollutant outputs.
Additional KPIs will explore social, economic, human performance, and liability risk aspects.
Expected Benefits
- Reduced recovery time
- Lower average travel time and distance per connected vehicle
- Reduced economic losses due to travel delays
- Lower total emissions of CO₂ and NOₓ
Contribution to the CONDUCTOR Project
- Direct communication between traffic managers and CAVs
- Customised routing based on incident type and location
- Enhanced network resilience and decision-making support
Deployment Architecture
Figure 1 illustrates the simulation process using Aimsun Next to evaluate the impact of planned and unplanned events on the M-30 and surrounding road network. A user initiates the process by providing scenarios with either planned or unplanned events. Depending on the event type, the system runs the corresponding simulation and outputs KPIs in CSV format to quantify the impacts, establishing baseline conditions.
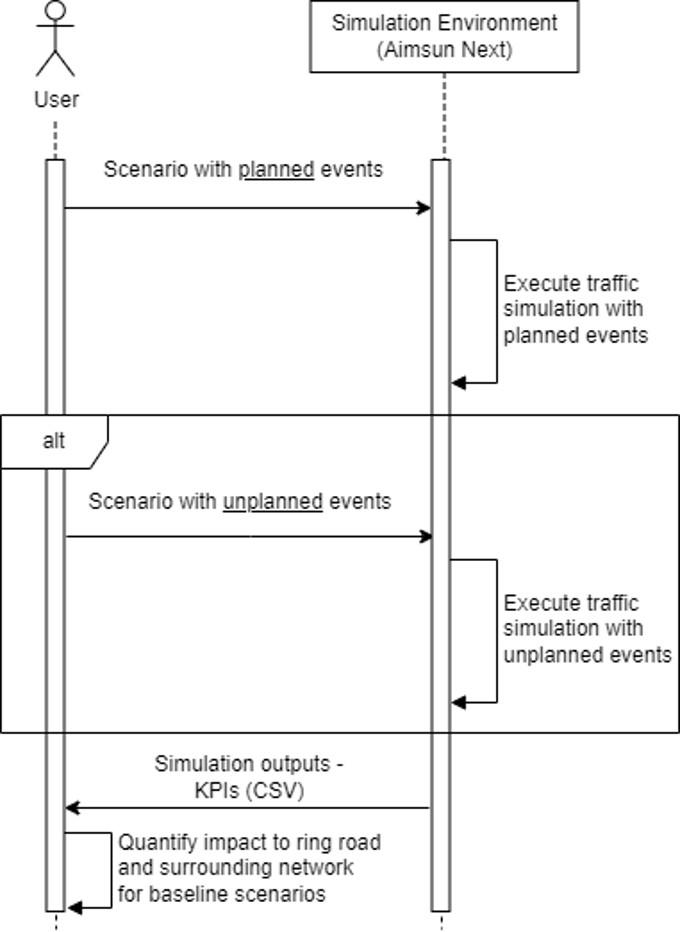
Figure 1. Process view of identifying the traffic impact of planned/unplanned events using Aimsun Next.
Figure 2 outlines the process of estimating travel demand and managing the routing of CAVs under various scenarios. Data from sources such as mobile networks, land use data, census data, and travel surveys is processed by the Data Fusion module to generate origin-destination matrices segmented by trip and traveller characteristics.
The estimated demand and fleet data are passed to the Hierarchical Traffic Scheduling and Control module, which monitors traffic and generates optimised routing strategies. These are then translated into route-wise CAV distributions.
Finally, the simulation incorporates these distributions, executes traffic scenarios, and compares the results against the baseline to assess strategy effectiveness.
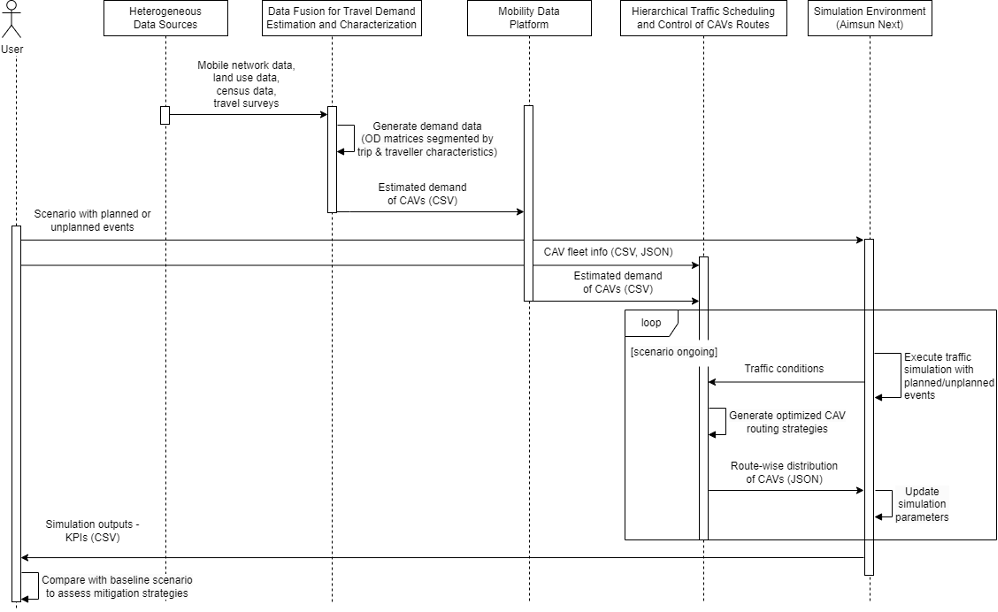
Figure 2. Process view of travel demand estimation and CAV routing management.